Slide Guide & Template
Market Size
Your market size slide will require the most research outside of your deck. Don't just grab some "X Industry is $XB" figure from the internet and say "if we capture just 1% of that we'll be rich!". The market size stated should be the market for your offering, not some arbitrary %. The best market estimates are rooted in bottom-up analysis derived from your business model. "X Annual Customer Value * Y Potential Customers = Z Market Size". Rinse and repeat for various customer types you plan to pursue. Remember, VCs are just gamblers in disguise, most of their investments fail. So they're looking for opportunities that can yield outsized returns to offset their portfolio losses. Your market size should be big enough and your forecasted growth aggressive enough to enable such a return.
When to Include It
Always. It's crucial for demonstrating the potential scale and opportunity of your venture.
Where to Place It
Early in the deck. We like to follow the business model slide with it but market figures can sometimes be a part of your problem slide narrative.
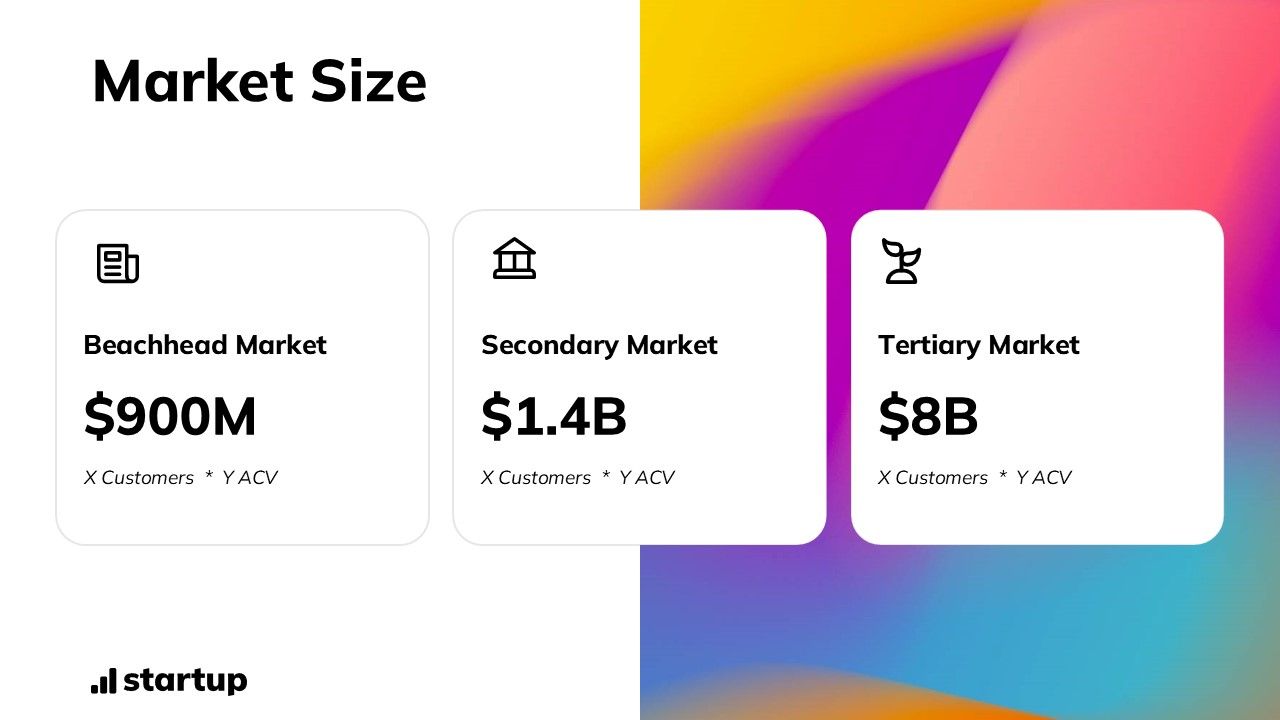
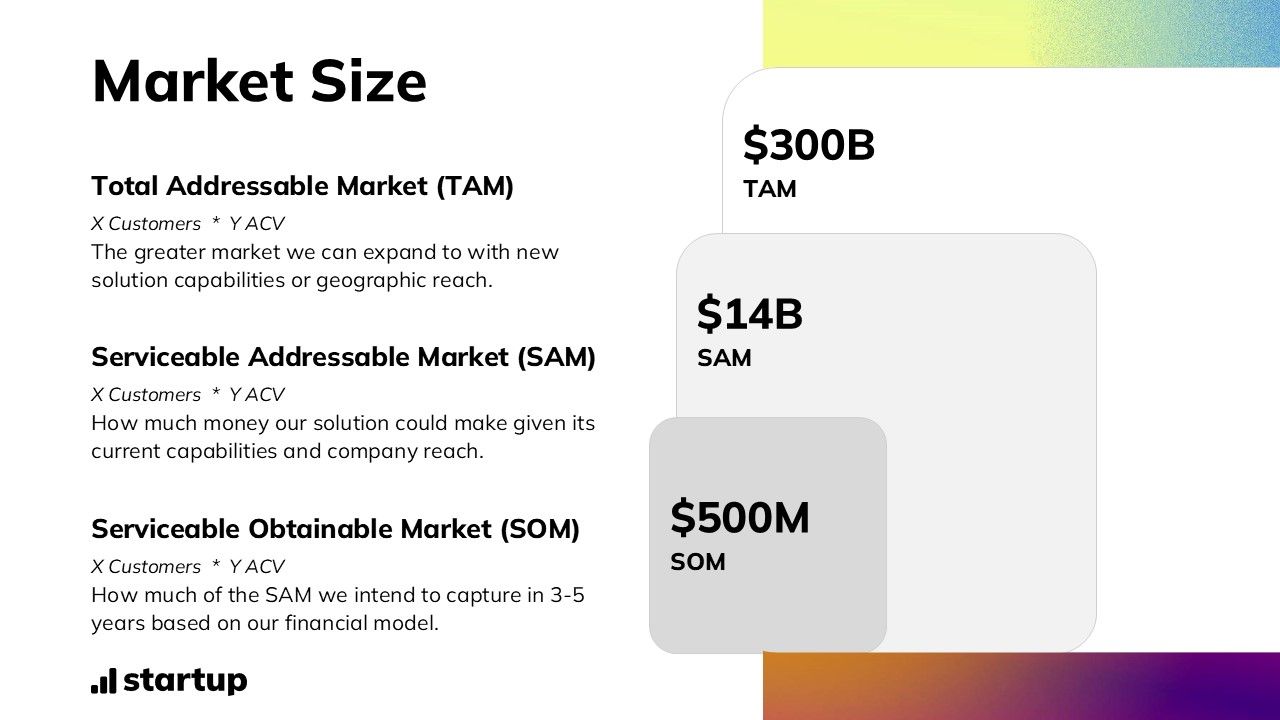
Market Size Slides from Our Template:
Download Slides


How to Calculate Your Market Size
Calculating a realistic market size isn't just a checkbox for your pitch deck - it's a crucial exercise that'll shape your strategy and keep you honest about your startup's true potential. Let's break it down step by step, using the traditional approach and our newer, preferred approach.
The Old School: TAM, SAM, SOM
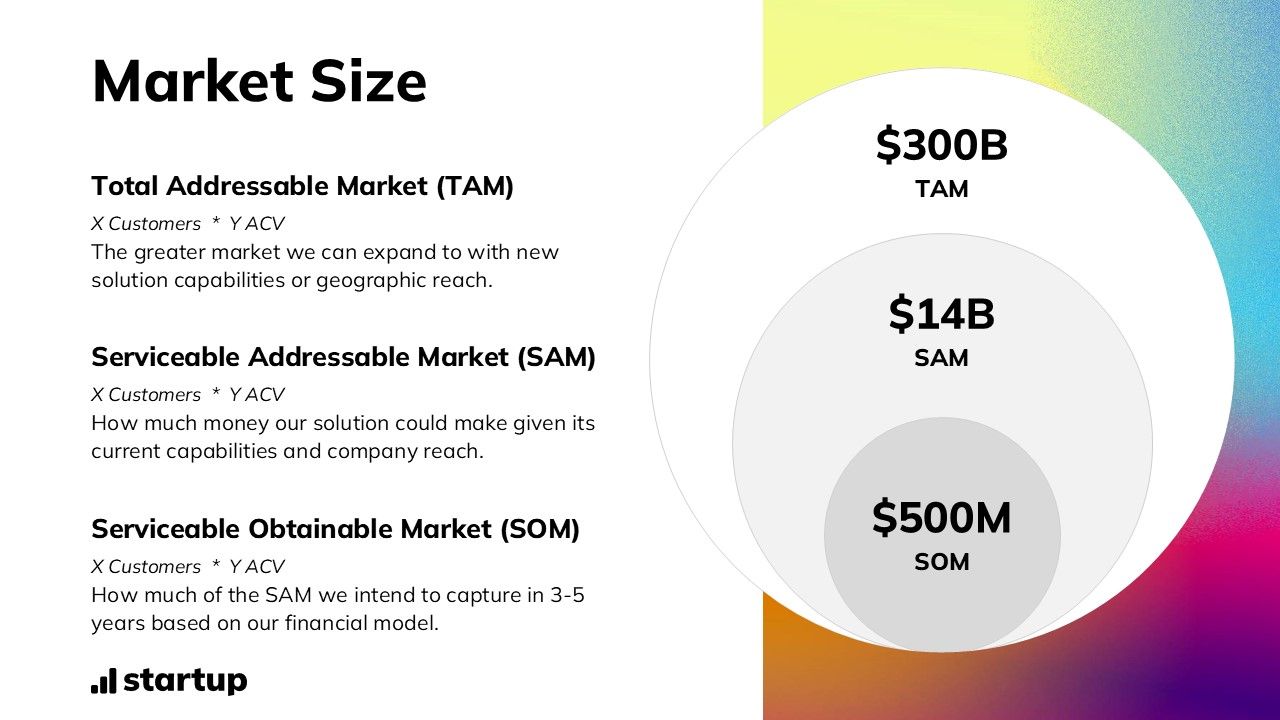
Let's start with the standard approach, typically displayed as three nested circles. Most VCs are used to seeing this, so you might need to play along. But without understanding what they're for it's easy to fill these bubbles with garbage numbers that will make your pitch and market understanding fall short.
TAM (Total Addressable Market)
This is the big kahuna—the entire market you could theoretically expand into in the long run if the stars aligned. Think big, but stay in reality. This should include potential geographic expansions and future product capabilities.
Example: Let's say you're launching a new cybersecurity software company focusing on AI-powered threat detection. Your TAM might be the global cybersecurity market, valued at something like $217 billion in 2021. Again, this number isn't about your current product features or company's current reach, it's about showing the playing field you're operating it.
SAM (Serviceable Addressable Market)
Now let's get more realistic. The SAM is the slice of the TAM that your current offering can actually serve, given your current product capabilities and geographic reach. Be honest here - your SAM might be narrower than you initially think.
Example: Your AI threat detection software might initially focus on mid-sized enterprises in North America. It isn't robust enough for enterprise and it isn't self-service enough for small businesses. But let's get even more specific: your product is optimized for cloud-native environments and integrates best with specific tech stacks. Taking these factors into account, your true SAM could be around $5 billion, representing the spend on advanced threat detection solutions by cloud-native, mid-sized companies in North America using compatible tech stacks.
SOM (Serviceable Obtainable Market)
Now that we've stated the market for our current offering, we want to tell investors how much of that SAM we plan to actually capture. The SOM is essentially just your 3-5 year growth forecast. It should tie directly to your financial model and represent what you can realistically capture, based on concrete projections.
For our cybersecurity startup, let's break it down:
- Year 1: 50 customers x $100,000 Average Contract Value (ACV) = $5M SOM
- Year 2: 150 customers x $120,000 ACV = $18M SOM
- Year 3: 300 customers x $150,000 ACV = $45M SOM
- Year 4: 500 customers x $180,000 ACV = $90M SOM
- Year 5: 750 customers x $200,000 ACV = $150M SOM
This gives us a 5-year SOM of $150 million. Notice how this is derived from specific growth and pricing assumptions.
What Not To Do: The "1% Fallacy"
The classic mistake we see all too many founders make is: "If we can just capture 1% of this huge TAM/SAM, we'll be a billion-dollar company!" While this might sound compelling at first glance, this approach is deeply flawed. For starters, it's completely arbitrary. What deity gave you the right to 1% of that market? If we're pulling numbers from nowhere why not make it 10%, or even 50%! Or maybe more realistically 0.1%. Markets are rarely homogeneous and equally accessible. Your SAM should be based on your current product capabilities and current geographic reach. And it should ideally be narrowed down to the group of users who stand to gain the most from your offering - not all who might like it. It's far more compelling to show how you'll dominate a well-defined niche than to make vague claims about capturing a tiny slice of an enormous pie. Your SOM should also not be an arbitrary slice of the SOM. Again, it should be rooted in your actual gameplan for growth and financial model if available.
The Problem with TAM/SAM/SOM
Frankly, we try and avoid using TAM/SAM/SOM when we can. It seems to have spread not on its merits but on the distinctiveness of the three circles. While TAM's are sometimes useful for painting a picture of a huge future expansion opportunities, it says nothing of your product today. SAMs done well tell a little more about your product's current appeal but the figure inherently bunches together various markets with different interests in your product. For the cybersecurity firm mentioned before, mid-sized financial or medical enterprises with regulatory oversight will certainly have higher need for threat detection than say a restaurant chain or advertising agency.
SOMs are useful for showing your ambition but the figure is already inferred via your financials slide. So why be repetitive? TAM/SAM/SOM can sometimes work well for startups that are going after established markets with entrenched players. This is typically companies with incredible IP that allows them to massively undercut on price or out-deliver on performance. Like let's say a data storage company that has novel tech that can store archives at half the price of the competition.
But most startups aren't tackling existing markets so published market figures are of little use. Instead, most startups are creating entirely new markets that need a different, bottom-up approach to calculating market size.
The Smarter Play: Beachhead + Buckets
We encourage most founders to explore a different approach. The beachhead market approach forces you to identify a specific, winnable segment to dominate before expanding your product capabilities or geographic reach.
Step 1: Identify Your Beachhead
Find the group of customers who are absolutely dying for your solution right now. These should be customers who:
- Have the pain point you're solving
- Have budget to pay for a solution
- Are accessible to your sales and marketing efforts
Example: Let's consider a startup creating a SaaS platform for precision agriculture, focusing on crop yield optimization and resource management. Their beachhead might be "mid-sized corn farmers in the U.S. Midwest with 500-2000 acres, who are tech-savvy but struggle with data-driven decision making."
Step 2: Define Your Beachhead Clearly
Get specific about:
- Demographics
- Psychographics
- Buying behavior
- Size of this market segment
Example: Our precision agriculture SaaS platform beachhead market might look like this:
- Corn farmers in Illinois, Iowa, Nebraska, and Indiana
- Farm size between 500-2000 acres
- Annual revenue between $500,000 and $2 million
- Currently using basic digital tools but not a comprehensive farm management system
- Interested in maximizing yield and minimizing input costs
- Open to new technologies but cautious about ROI
- Estimated population: 50,000 farms meeting these criteria
Step 3: Identify Adjacent "Buckets"
Once you've nailed your beachhead, identify 3-5 adjacent market segments you could expand into next. These could involve expanding product capabilities or geographic reach.
Example:
- Soybean farmers in the same Midwest states (product capability expansion)
- Corn farmers in other U.S. states or Canada (geographic expansion)
- Larger corn farms (2000+ acres) in the Midwest (moving upmarket, likely through product capability expansion)
Step 4: Size Each Bucket
Use a bottom-up approach of simple math to size each of these markets.
Example:
- Beachhead: 50,000 farms x $2,000/year average subscription = $100 million/year
- Bucket 1: 40,000 farms x $1,800/year avg. subscription = $72 million/year
- Bucket 2: 60,000 farms x $2,000/year avg. subscription = $120 million/year
- Bucket 3: 5,000 farms x $5,000/year avg. subscription = $25 million/year
Your beachhead should be what your current product and geographic reach can service. The follow-on buckets might also be currently serviceable (but with maybe less customer pain) or maybe not serviceable without product/geographic expansion.
These buckets are essentially your growth roadmap in addition to your market size. You might still include a TAM to show the bigger picture (like the entire agricultural technology market). But ideally your combined buckets are big enough to hook investors.
Don't: "Boil the Ocean"
A common mistake is trying to target everyone right from the start. This is the opposite of a beachead approach.
Example of what not to do: The founder of our precision agriculture SaaS claims their beachhead market is "all farmers in North America." When asked to narrow it down, they resist, insisting their tool is so versatile it can work for everyone from small organic vegetable farms to large industrial cattle ranches.
Why it's wrong: This approach leads to unfocused product development, scattered marketing efforts, and difficulty in establishing a strong market position. It's better to dominate a niche and expand from there. A focus on mid-sized corn farmers allows for tailored features, targeted marketing, and a strong value proposition for a specific customer type. It can also show that your idea was born out of a real world problem.
Bottom-Up vs. Top-Down: Choose Wisely
Throughout this explainer we've hinted at two different ways of getting market figures - top-down and bottom-up. Let's dive a little deeper so things are clear.
Top-Down: The Quick and Dirty
Start with a big market figure and whittle it down to just the folks who'd actually use your product. It's fast, and it works if you're entering an established market. But it's also easy to fudge and hard to defend.
Example (Top-Down for our precision agriculture SaaS):
- Total corn farms in the U.S.: 300,000
- Percentage in target Midwest states: ~60% = 180,000
- Percentage with 500-2000 acres: ~30% = 54,000
- Percentage likely to adopt SaaS solutions: ~40% = 21,600
- Estimated annual spend on farm management software: $2,000
- Market size: 21,600 x $2,000 = $43.2 million
Bottom-Up: Roll Up Your Sleeves
This is the way to go, especially if you're creating a new market or have a clearly defined initial target. The formula is simple:
Market Size = (Number of Potential Customers) x (Average Annual Customer Value)
It's more work, but it forces you to think critically about who your customers really are and how much value you're providing.
Example (Bottom-Up for the same precision agriculture SaaS):
- Corn farms 500-2000 acres in Illinois: 15,000
- Corn farms 500-2000 acres in Iowa: 14,000
- Corn farms 500-2000 acres in Nebraska: 12,000
- Corn farms 500-2000 acres in Indiana: 9,000
- Total target customers: 50,000
- Estimated adoption rate in first 5 years: 30% = 15,000
- Average annual subscription: $2,000
- Market size: 15,000 x $2,000 = $30 million
This approach pairs perfectly with the beachhead strategy, giving you a compelling and defensible story.
The Real Value
Here's the secret: the process is more valuable than the final number. Digging into market sizing forces you to confront hard questions about your business model, target customers, and growth strategy—including how you'll expand your product capabilities and geographic reach over time.
Don't obsess over getting to some massive TAM. Instead, focus on finding markets that are:
- Big enough to matter
- Small enough for you to dominate
Remember, it's better to own 100% of a small market than 1% of a huge one where you'll just get crushed by the bigger fish. Start focused, then expand your product capabilities and geographic reach. That's how you build something that lasts.
© 2026 Superslates | LinkedIn | Site Terms | Privacy Policy